
| 일 | 월 | 화 | 수 | 목 | 금 | 토 |
|---|---|---|---|---|---|---|
| 1 | 2 | 3 | ||||
| 4 | 5 | 6 | 7 | 8 | 9 | 10 |
| 11 | 12 | 13 | 14 | 15 | 16 | 17 |
| 18 | 19 | 20 | 21 | 22 | 23 | 24 |
| 25 | 26 | 27 | 28 | 29 | 30 | 31 |
- object detection
- Anaconda
- pytorch
- MRI
- ml
- Cost Function
- pm2
- 평가지표
- NRMSE
- ubuntu
- https
- AWS
- Dual energy X-ray
- 동차좌표계
- Homogeneous Coordinates
- Emoji
- MySQL
- x-ray
- FSL
- error
- git
- CT
- kernel
- nodejs
- coursera
- relaxation time
- Map-reduce
- ssl
- EC2
- procedure
- Today
- Total
Pay it Forward
[Python] figure plot 관련 snippets (figure 여러개 띄우기, grid 없애기) 본문
[Python] figure plot 관련 snippets (figure 여러개 띄우기, grid 없애기)
minjoony 2021. 8. 13. 14:06Figure 여러개 띄우기
import matplotlib.pyplot as plt

fig = plt.figure()
rows = 1; cols = 3

ax1 = fig.add_subplot(rows, cols, 1)
ax1.set_title('img 1')
ax1.imshow(img_1)

ax2 = fig.add_subplot(rows, cols, 2)
ax2.set_title('img 2')
ax2.imshow(img_2)

ax3 = fig.add_subplot(rows, cols, 3)
ax3.set_title('img 3')
ax3.imshow(img_3)

fig.tight_layout()
plt.show()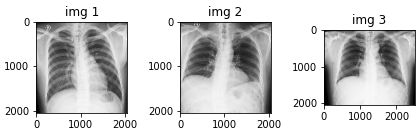
Figure grid(눈금) 없애기
단일 figure인 경우 plt.xticks/yticks, 다중 figure인 경우 set_xticks/set_yticks 이용
import matplotlib.pyplot as plt

### 단일 figure인 경우 ###
plt.imshow(img_1)
plt.xticks([])
plt.yticks([])
plt.show()

### 다중 figure인 경우 ###
fig = plt.figure()
rows = 1; cols = 3

ax1 = fig.add_subplot(rows, cols, 1)
ax1.set_title('img 1')
ax1.grid(False)
ax1.set_xticks([])
ax1.set_yticks([])
ax1.imshow(img_1)

ax2 = fig.add_subplot(rows, cols, 2)
ax2.set_title('img 2')
ax2.grid(False)
ax2.set_xticks([])
ax2.set_yticks([])
ax2.imshow(img_2)

ax3 = fig.add_subplot(rows, cols, 3)
ax3.set_title('img 3')
ax3.grid(False)
ax3.set_xticks([])
ax3.set_yticks([])
ax3.imshow(img_3)

fig.tight_layout()
plt.show()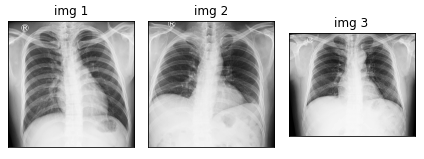
Figure range plot (pixel 범위, colorbar 띄우기)
plt.colorbar 이용
import matplotlib.pyplot as plt

fig = plt.figure()
rows = 1; cols = 2

ax1 = fig.add_subplot(rows, cols, 1)
ax1.set_title('img1')
image1 = ax1.imshow(img1, cmap='gray')
plt.colorbar(image1, fraction=0.046, pad=0.04)

ax2 = fig.add_subplot(rows, cols, 2)
ax2.set_title('img2')
image2 = ax2.imshow(img2, cmap='gray')
plt.colorbar(image2, fraction=0.046, pad=0.04)

fig.tight_layout()
plt.show()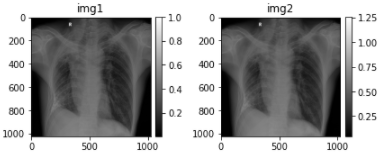
Figure 크기(size) 조절하기
figure의 파라미터 figsize로 조절
fig = plt.figure(figsize=(16, 16))
rows = 1; cols = 2

ax1 = fig.add_subplot(rows, cols, 1)
ax1.set_title('img1')
image1 = ax1.imshow(img1, cmap='gray')

ax2 = fig.add_subplot(rows, cols, 2)
ax2.set_title('img2')
image2 = ax2.imshow(img2, cmap='gray')

fig.tight_layout()
plt.show()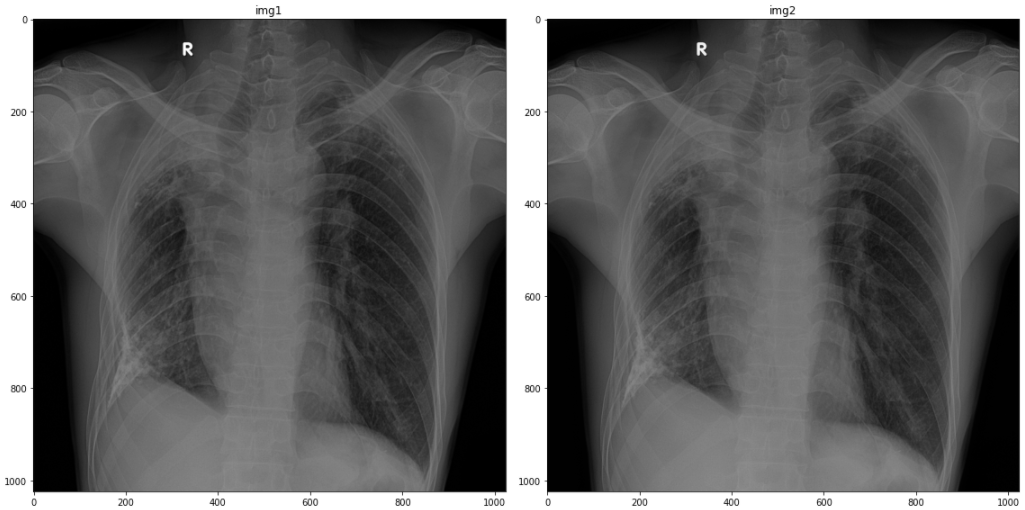
다중 Figure 크기(subplot size) 다르게 조절하기
gridspec을 이용하여 width와 height의 비(ratio)를 조절할 수 있다.
nrows, ncols에 행과 열의 개수를 작성하고, width_ratios=[a, b], height_ratios=[c, d]로 width와 height 비를 조절한다.
import matplotlib.pyplot as plt
from matplotlib import gridspec

fig = plt.figure()
rows = 1; cols = 2
spec = gridspec.GridSpec(nrows=2, ncols=2,
                         width_ratios=[3, 1])

ax1 = fig.add_subplot(spec[0])
ax1.set_title('img1')
img1 = ax1.imshow(img_ori, cmap='gray')

ax2 = fig.add_subplot(spec[1])
ax2.set_title('img2')
img2 = ax2.imshow(MFB_total_img, cmap='gray')

fig.tight_layout()
plt.show()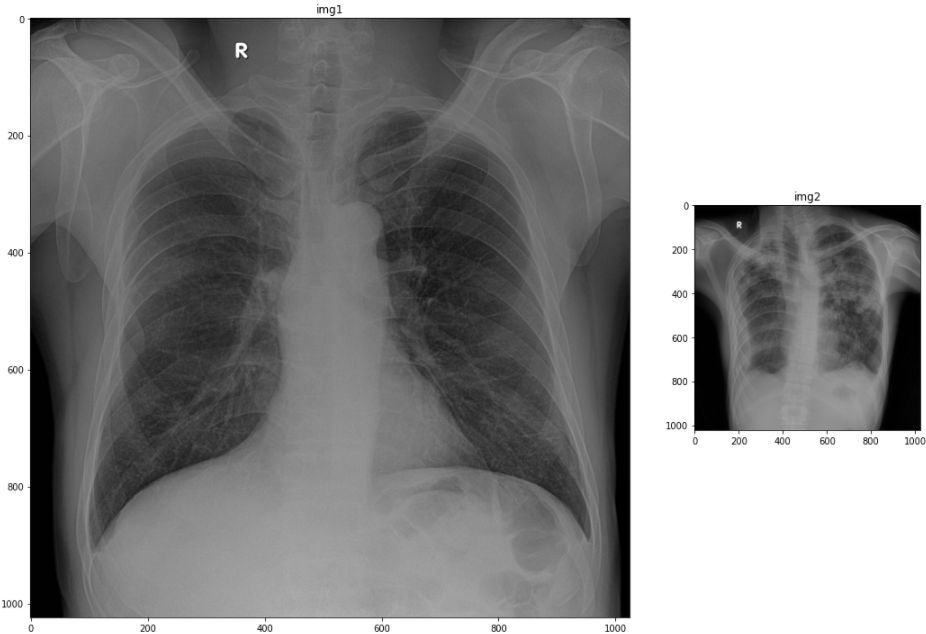
이미지 histogram 그리기
plt.hist 함수를 이용하여 이미지 pixel값들의 히스토그램(histogram)을 출력할 수 있다.
hist의 인자는 (이미지 array, x축 막대그래프의 개수, x축의 범위)로 지정된다.
이 때, 이미지 array는 (n,)의 shape을 가져야 하므로 ravel()함수를 사용하여 1차원으로 펴준다.
또한, x축의 범위는 pixel histogram을 보고자 하는 이미지 pixel값의 range로 생각하면 된다.
위의 다중 figure 크기 조절과 함께 사용하여 다음과 같이 이미지 밑에 histogram을 띄울수도 있다.
아래 예시 코드는 각 이미지에 대하여 x축 막대그래프의 개수를 1024개로 쪼개며,
image가 0~1의 pixel 값을 갖는grey scale이므로 x축 범위를 [0,1]으로 지정한 것이다.
(대부분의 이미지는 png의 경우 0~256을 가지므로 [0,256]으로 지정한다.)
histogram을 이미지보다 작게 띄우기 위하여 위에서 설명한 gridspec을 사용하여 height_ratios를 3:1로 하였다.
import matplotlib.pyplot as plt
from matplotlib import gridspec

fig = plt.figure(figsize=(20, 16))
rows = 2; cols = 2
spec = gridspec.GridSpec(ncols=2, nrows=2,
                         height_ratios=[3, 1])

ax1 = fig.add_subplot(spec[0])
ax1.set_title('img1')
ax1.set_xticks([])
ax1.set_yticks([])
img1 = ax1.imshow(image1, cmap='gray')
plt.colorbar(img1, fraction=0.046, pad=0.04)

ax2 = fig.add_subplot(spec[1])
ax2.set_title('img2')
ax2.set_xticks([])
ax2.set_yticks([])
img2 = ax2.imshow(image2, cmap='gray')
plt.colorbar(img2, fraction=0.046, pad=0.04)

ax3 = fig.add_subplot(spec[2])
ax3.hist(image1.ravel(), 1024, [0,1])

ax4 = fig.add_subplot(spec[3])
ax4.hist(image2.ravel(), 1024, [0,1])

fig.tight_layout()
plt.show()
'Code Snippet' 카테고리의 다른 글
| [Python] raw file 열기 및 plot하기 (0) | 2022.07.15 |
|---|---|
| [Python] print '...' (생략) 없애기, 값 모두 출력하기 (0) | 2022.04.26 |
| [C++] Sort의 Sorting Function 만들기 (0) | 2020.01.17 |

